Not all technologies are made equal or are appropriate for the elementary (or secondary) classroom. One way to evaluate whether to use (and invest in) a new technology for your classroom is to apply the SAMR theory of technology adoption created in 2010 by Ruben Puentedura. According to this theory, while some technology is designed to enhance learning, others can actually transform learning. Technologies that are simply a substitution for the same non-technical activities sit at one end of a spectrum, while technologies that allow for new, previously inconceivable tasks, sit at the opposite end of the spectrum and can redefine learning. As teachers, is is important to identify what, exactly, a new technology will bring to your activity or lesson. Does the technology improve the process and how is the new task uniquely made possible by the new technology? I think that by asking these questions first and identifying where on the spectrum a tempting new technology sits I will be better able to make intentional decisions about what I want to invest time and money into for my classroom.
Today we explored using doodles and graphics to apply Dual Coding Theory and the Multimedia Learning Theory to learning. Sketchnotes, which I have been reassured emphasize ideas and do note rely on polished artistic skills, allow the learner to process and refine the information that is being presented. The resulting notes and doodles cement the facts or figures in the learners’ mind, ensuring that they retain more information than if they had simply transcribed the lecture or presentation. We also looked at digitally creating infographics which serve much the same purpose of Sketchnotes with one major difference. While Sketchnotes are created by the learner as they are learning (or listening), infographics are created by the teacher in order to share essential information in an accessible and visually appealing way. Effective infographics need to be accurate, have simple legible fonts, and have simple illustrations that complement the information being conveyed. For an example of a Sketchnote and an infographic, please see images that follow below:
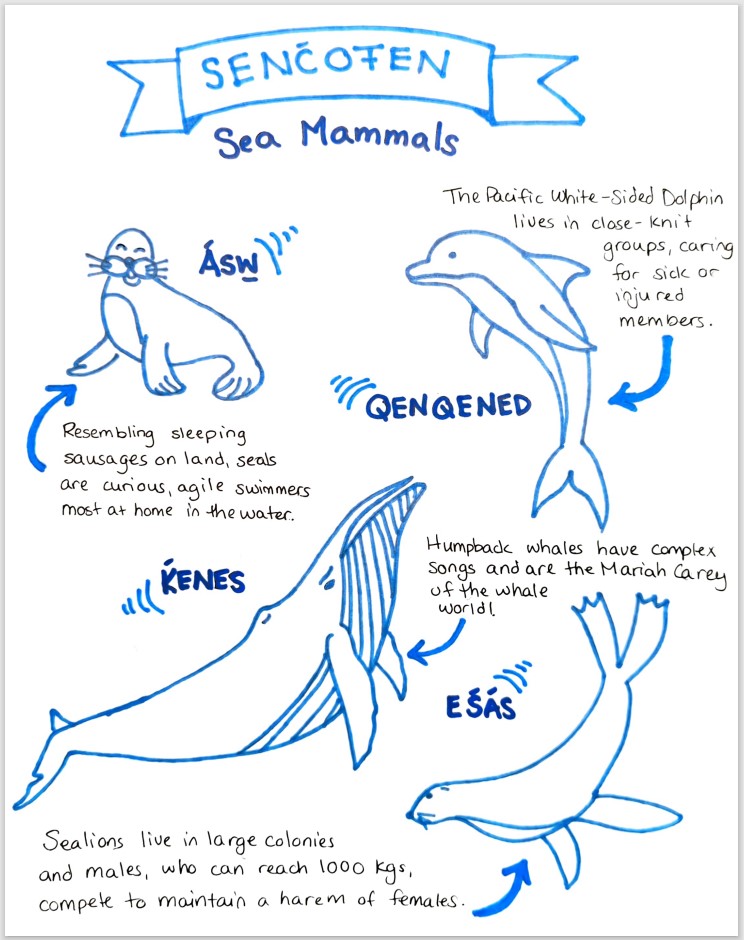
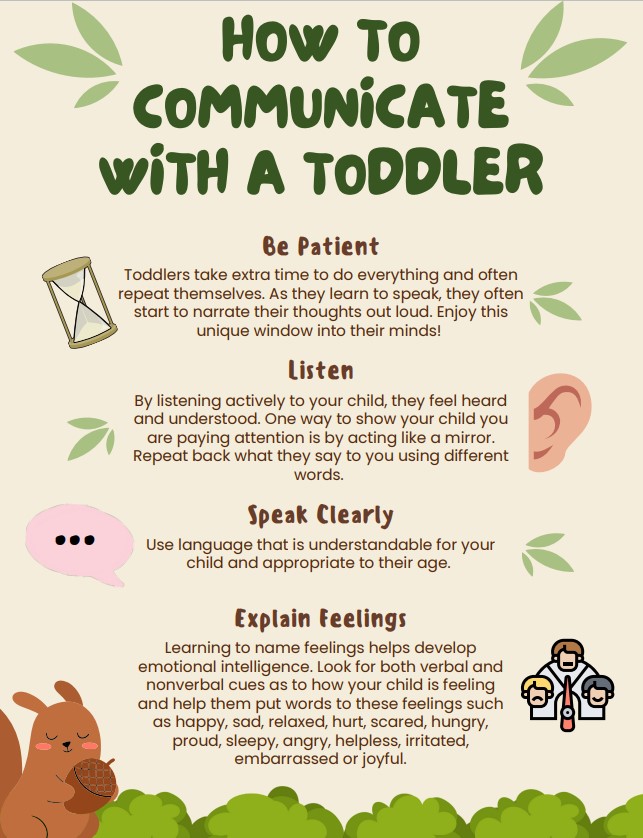
As I hope to teach Grade 2 – Grade 6, I think that I could use sketchnoting and infographics to help my students learn and to share information my students and their parents respectively. In a way, that this age group is already familiar with a form of sketchnotes, since much of their written material is accompanied by drawings and illustrations. By the time students reach secondary school, sketchnoting skills could be an extremely useful technique to have already mastered and so starting to practice and develop this skill in elementary could be extremely beneficial to students’ success in high school and post secondary school. In addition, I image that these tools are especially helpful for students who struggle with written literacy and for EAL learners and their families.
Maia, I absolutely LOVE both your sketchnote and your infographic! I enjoyed learning the SENĆOŦEN names for our local sea mammals. I was also delighted to learn about how to best communicate with a toddler! I definitely agree with your point that as teachers we need to think about what a new technology will bring to our activity or lesson. In addition to learning sketchnoting, I wonder if your future students might enjoy learning how to use Canva to make infographics? (And not just the teacher?) Thank you for a very entertaining and enjoyable blog post!